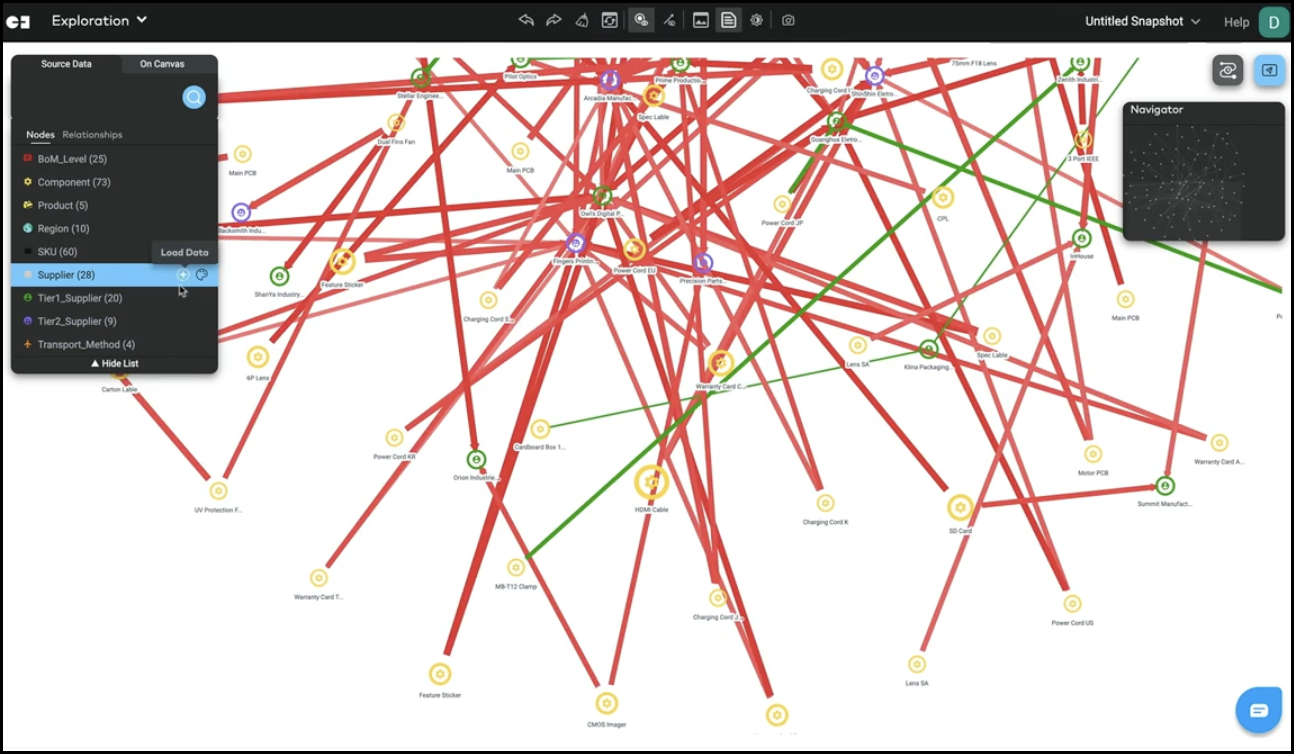
https://youtu.be/vw59UklAFus Dynamic supply chains demand adaptability and responsive, data-driven digital networks. Gemini Explore for Supply Chain Optimization visualizes the relationships between suppliers, manufacturers, and customers as a network, including transportation routes and other dependencies. This helps supply chain professionals minimize risk, identify single points of failure or bottlenecks, and develop contingency plans. In this demo, […]
Month: June 2023
Strategic Supplier Management
https://youtu.be/4kTbgl8CsQY Navigating today’s dynamic supply chain conditions demands adaptability and responsive, data-led digital supply networks. Gemini Explore for Supply Chain Optimization shows suppliers, manufacturers, and customers as members of a network connected by relationships like transportation routes and other dependencies. This helps supply chain professionals minimize risk, identify single points of failure or bottlenecks, and […]
Supply Chain Tactical Response
https://youtu.be/E1wmslc26Ms Dynamic supply chains require adaptability and responsive, data-driven digital networks. Gemini Explore for Supply Chain Optimization visualizes suppliers, manufacturers, and customers as members of a network connected by relationships such as transportation routes and other dependencies. This helps supply chain professionals minimize risk, identify single points of failure or bottlenecks, and develop contingency plans. […]
Book Review: Knowledge Graphs
Sixing Huang reviews the new book by Jesús Barrasa, Amy E. Hodler, and Jim Webber.
Infographic: Visualizing Amazon’s Rising Shipping Costs
How Amazon kept up with impressive sales growth and market valuation while also confronting challenges in its shipping and fulfillment department.
3 Benefits of Digital Twins for Supply Chain Optimization
3 ways digital twins are transforming supply chain and logistics operations for companies all over the world.
Infographic: Visualizing Raw Material Inflation in Canada
A visual exploration of the effects of inflation on raw materials used by manufacturers in Canada.
5 Reasons Graph Data Projects Fail
The top 5 reasons graph data projects fail (and how to avoid them).
Infographic: The Future of Supply Chain Automation
This infographic explores the current state of automation in global supply chains and offers insights into future investment trends and dynamics.

